
This unit, 1.4, is the final section of the Population work. This is all to do with looking at global factors influencing where people live (or not) and how many people you might find in an area. There are two sister case studies for this section of both a dense and sparsely population country / area. Look out for that case study logo.
Population & the 2D's!
Download and work on one of the worksheets above. You will use it to complete the next 7 tasks as set out in the space below. Please use the hyperlinks and embedded images to help you to complete the activities.
Population Growth Trends
Task 1 - Make a note of the following reasons for population growth, on your worksheet.
1. Contraception - People are now able to choose when to have children (family planning)
2. Lower fertility rates - Parents realise that their children will survive past their first birthday due to medical advancements
3. Anti-Natalist policies - The former 'One Child Policy' in China aimed at cutting the fertility rate to below 2
4. Career Women - Now deciding to postpone starting family to focus on forging a career path and earning money
5. Children cost a lot! - It can cost upwards of $200,000 to bring up a child until they turn 18 years old!
Source: Gifer.com
Population Distribution
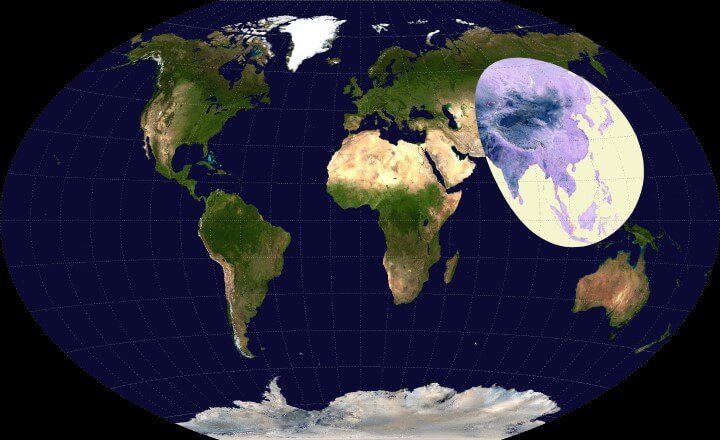
Don't believe everything you see though. This is the visualization, but we have to check it out. The countries in the circle are .
China: 1,349,585,838 people (per the Census again)
India: 1,220,800,359
Indonesia: 251,160,124
Bangladesh: 163,654,860
Japan: 127,253,075
Philippines: 105,720,644
Vietnam: 92,477,857
Thailand: 67,448,120
Burma: 55,167,330
South Korea: 48,955,203
Nepal: 30,430,267
Malaysia: 29,628,392
North Korea: 24,720,407
Taiwan: 23,299,716
Sri Lanka: 21,675,648
Cambodia: 15,205,539
Laos: 6,695,166
Mongolia: 3,226,516
Bhutan: 725,296
… which adds up to a grand total of 3,637,830,357, or roughly 51.4 percent of the global population of 7,083,460,000 (May 2013)
Task 2
i. Study the graphic and data above. In the space on your worksheet, identify the three most populous countries in this circle.
ii. Try to identify three issues that could be caused by having such a high concentration of population in this area (circle).
Objective: To describe the factors influencing the density and distribution of population
Study the map below carefully. It shows an alternative view of the world based on population distribution. The more inflated the country, the more people live there and visa versa.
Complete the following two tasks on your worksheet.
Task 3 - What does Population Distribution mean?
Task 4 - What does Population Density mean?
Task 5 - Write a good quality description of the distribution of the world’s most populous countries. Try to identify countries that have swelled hugely and those that have almost disappeared.
Map of the world - inflated to show high populations numbers & deflated to show low population numbers.
Click on this link to be taken to an excellent interactive site showing population density and distribution characteristics globally for the year 2015.
Task 6 - Population density is influenced by a number of factors. Try to explain why the following factors are important in determining whether people can survive in an area or not:
1. Availability of freshwater.
2. Communications (roads, railways, airports).
3. Proximity to the coastline.
4. Cities and their opportunities.
5. The shape (relief) of the land.
Task 7 - Using the embedded map on the worksheet, highlight two different parts of the world where each of the four factors is / is not available.
|
|
Objective: To find out what physical factors lead to densely and sparsely populated areas of earth.
Population density is normally worked out using the following formula:
Total Population / Total Land Area = Total Population Per Square KM.
Densely populated areas are where many people live and sparsely populated areas are where few people live.
Part 1 - Densely Populated Places - Hong Kong
Watch either of the 10 minute videos below that will introduce you to a place in the world that has an exceptionally high population density, as well as challenging levels of poverty.
|
|
|


Task 1 - Click on the photos above and study them carefully. Choose the photo that you are drawn to and copy it into a Word Document. Annotate it with as much information as possible. Include:
what it is?
who are these people?
where in the world is this?
why is it like this?
what are the challenges posed by this place?
Task 2 - On the same worksheet as in Task 1, use this website to take key data about Hong Kong, including its total population, total land area, total population density and how that ranks worldwide.
Task 3 - The impacts on Hong Kong - Use this website to make notes on the problems and solutions related to high population density in Hong Kong. Make sure you include at least three pieces of data.
|
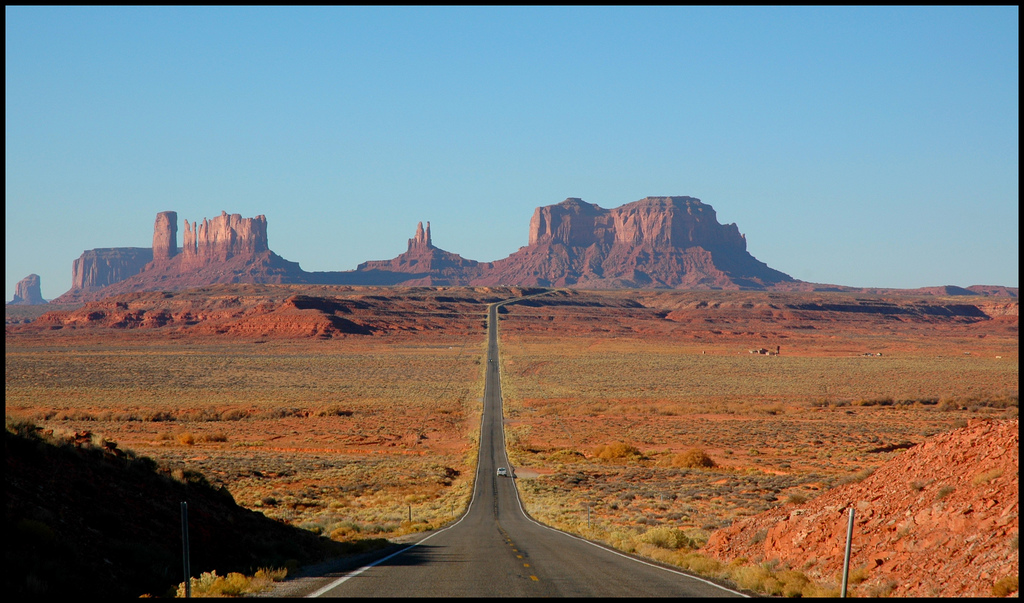
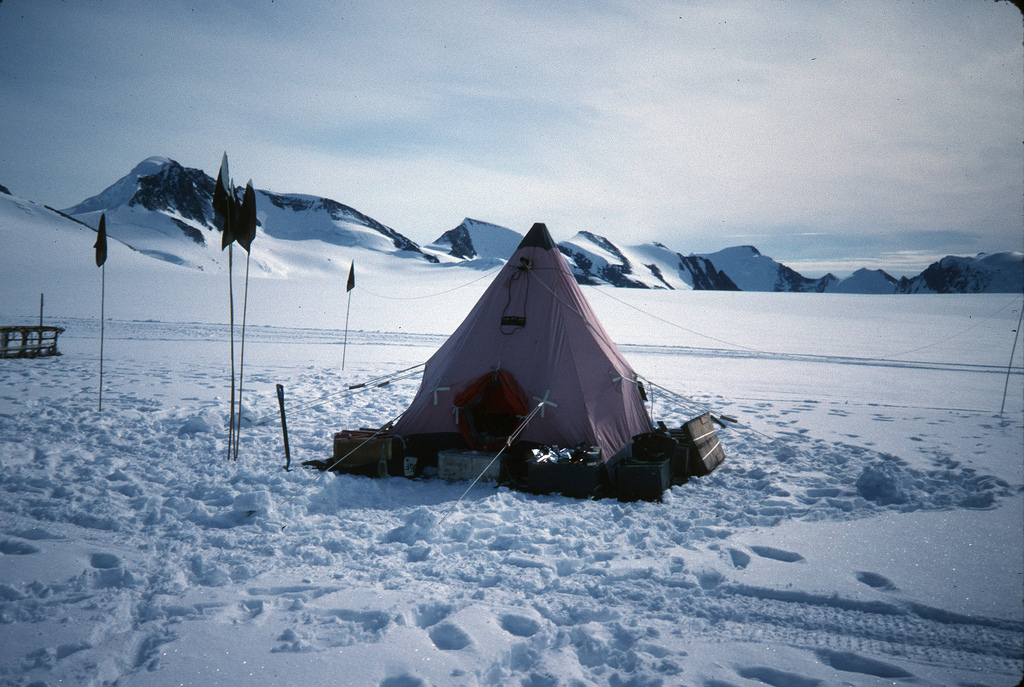
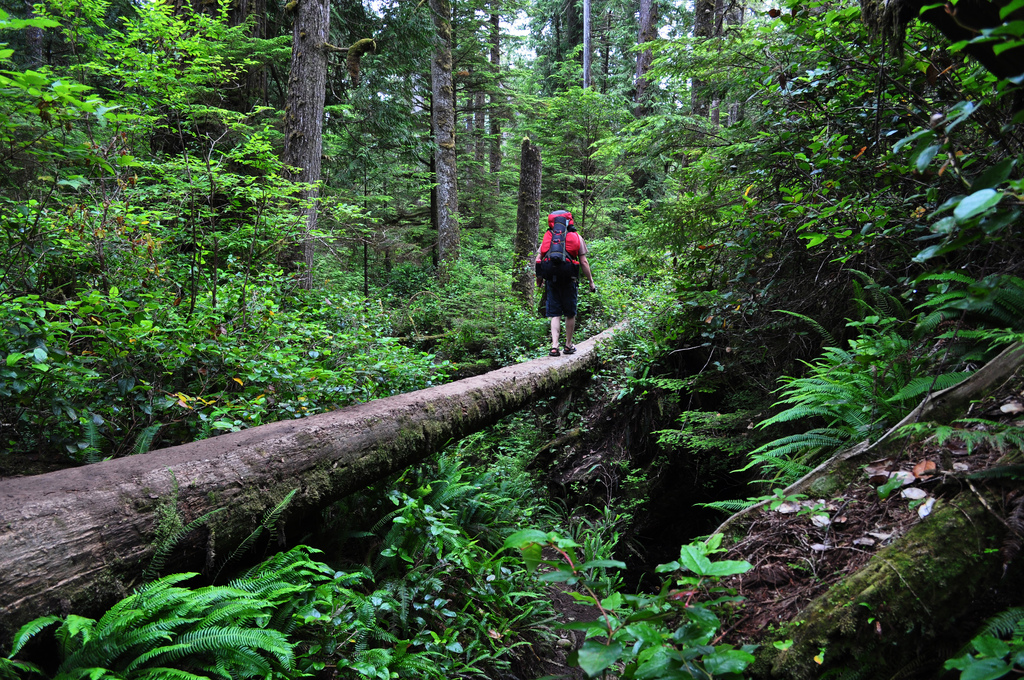
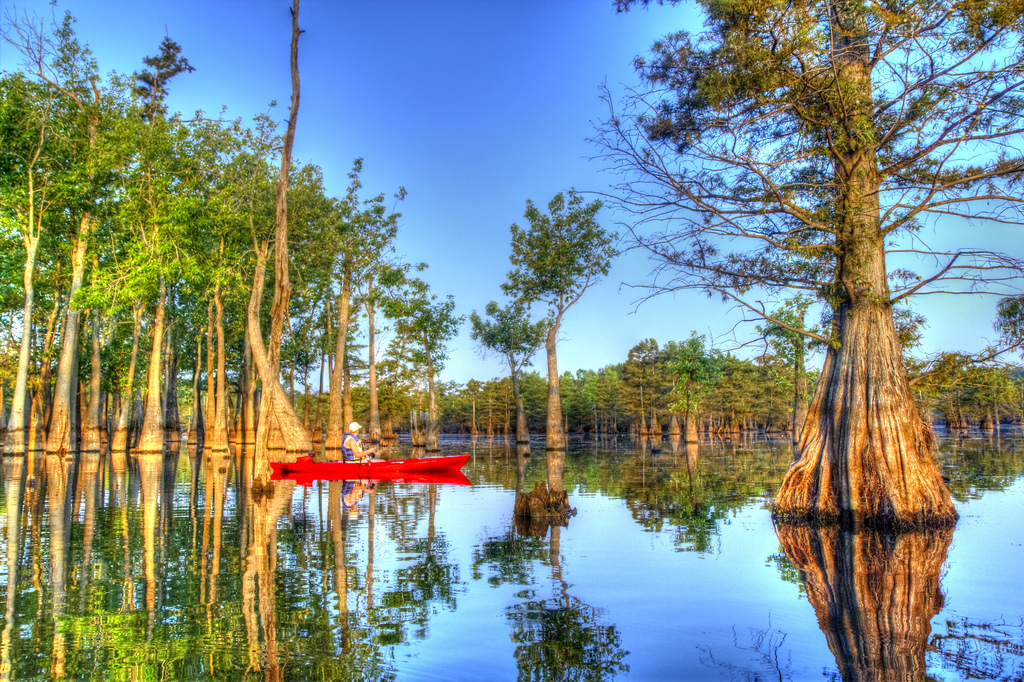
Part 2 - Sparsely Populated Places - (Chesterfield Inlet, Canada) Task 4 - Choose two of the images to the right hand side that show areas of the world that have low population densities. Click to enlarge. Complete the activities on the worksheet above. Task 5 - Review your learning. What are the physical and human factors that cause high and low population densities? Complete the activities on the worksheet below. Task 6 - Personal Geography - Go to Google and find your house on the satellite view map. Do you live in a sparsely or densely populated area, and why? What evidence can you find for this on your map and perhaps even on Google Streetview? |


|
|
Task 7 - The Case Study.
Using the video below, the map and your own research skills, produce a case study sheet on the settlement of Chesterfield Inlet, Canada. It should explain why it is sparsely population and should have at least 5 pieces of data. |
|
|
|
|