
What Do People Eat Around the World?
Study the images below carefully. You will see the weekly family food consumption / food shop for 12 different families in 12 different countries around the world. You can click on each image to enlarge and copy it for the activity below.
Task 1 - Match up each of the photos with the names of the families using the PowerPoint file below.
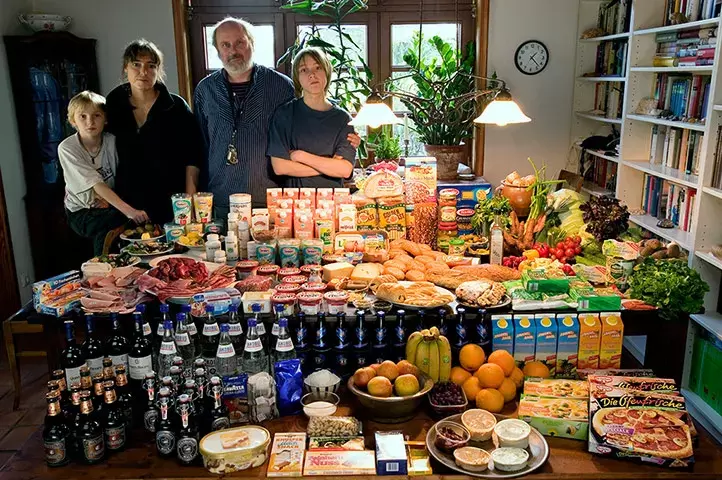
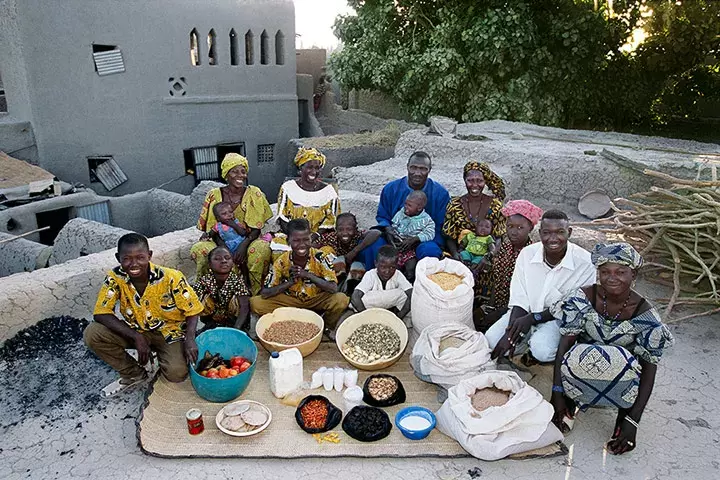
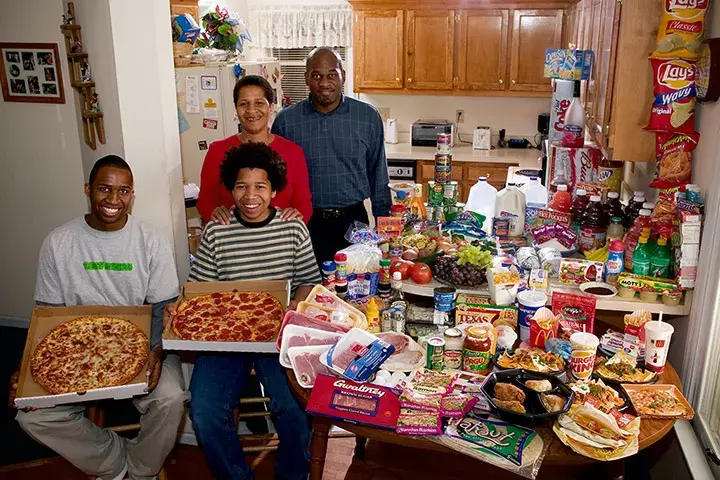

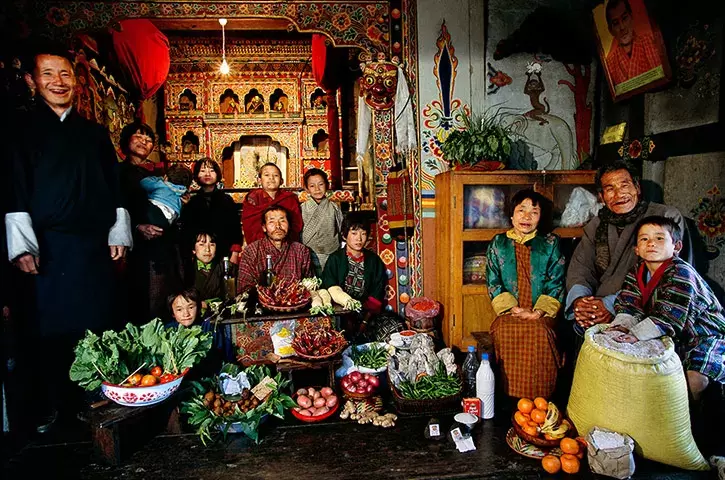
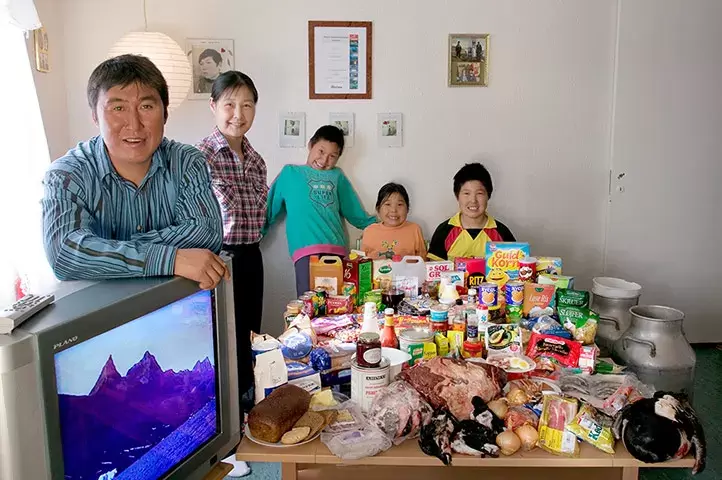
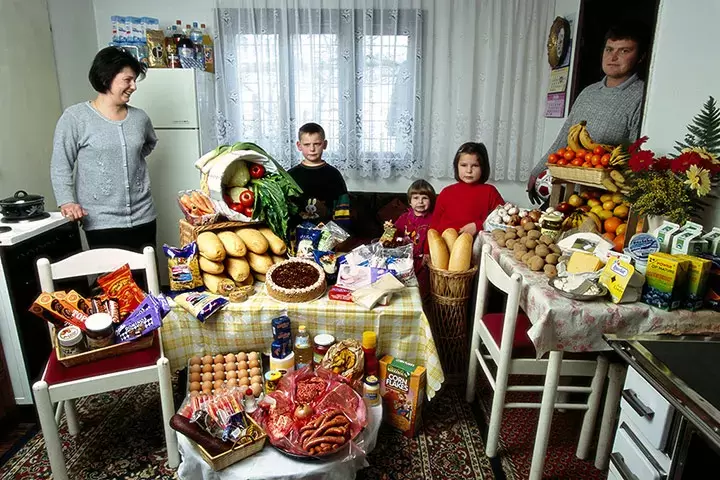
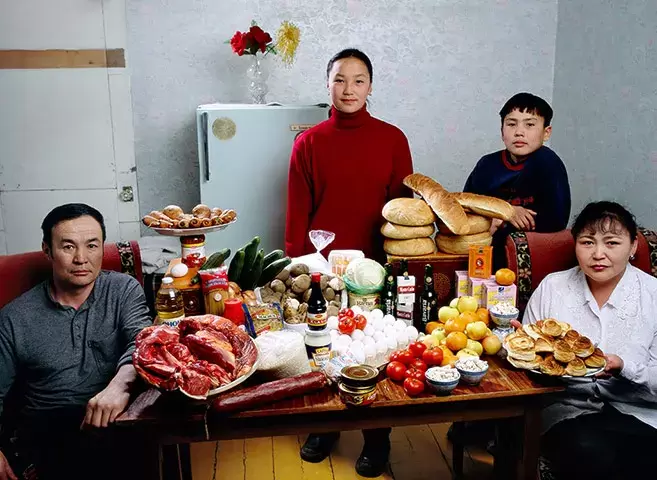
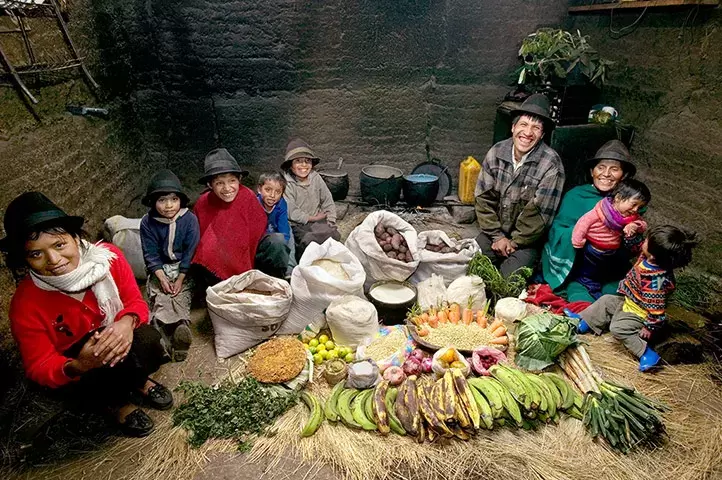
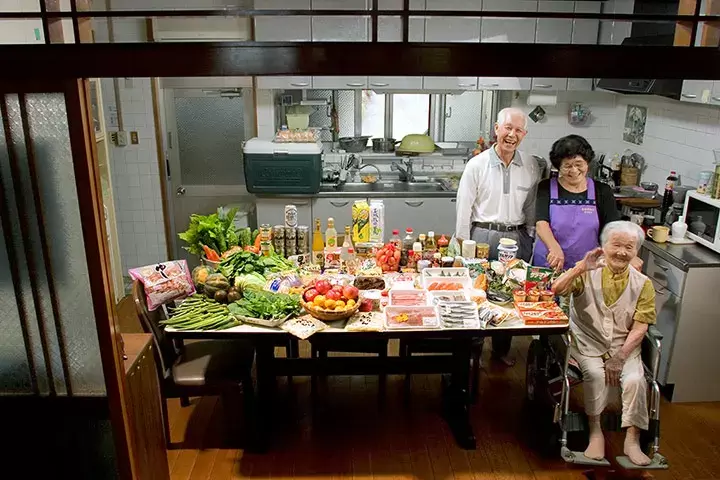
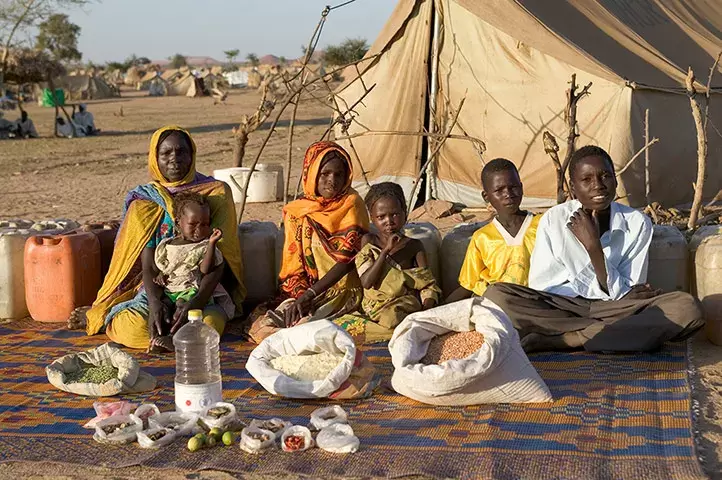
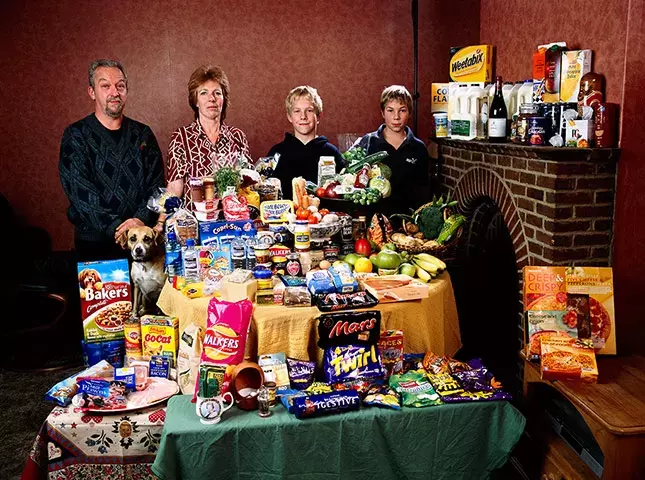
Task 2 - Your job is to now work in small groups to produce a physical display to show the differences in weekly diets for three different countries at different levels of economic development (LIC - MIC - HIC). The photos above were taken by Peter Menzel and you can see better quality versions of the photos above by clicking on this link.
You should choose three of the families above and create a display that includes
1. The three photos including the name of the family and their total weekly spend on their food
2. One map that shows the location of each of the countries
3. The developmental data for each of these three countries (GDP per capita, life expectancy, literacy rate - and overall HDI score)
4. Detailed analysis of each photo giving reasons for the very different diets that each family has and the impacts that has on the family.
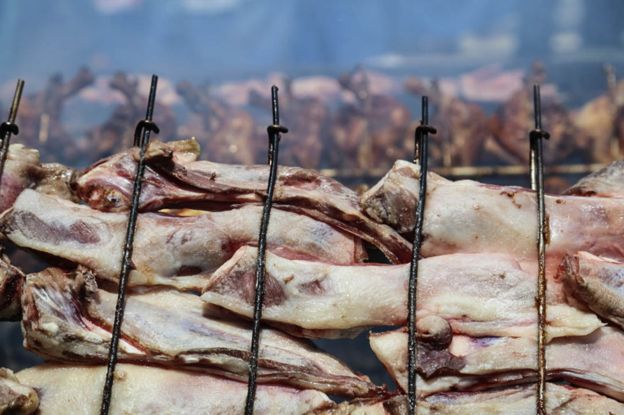
A World Of Plenty of Food & Drink?
|
|
|
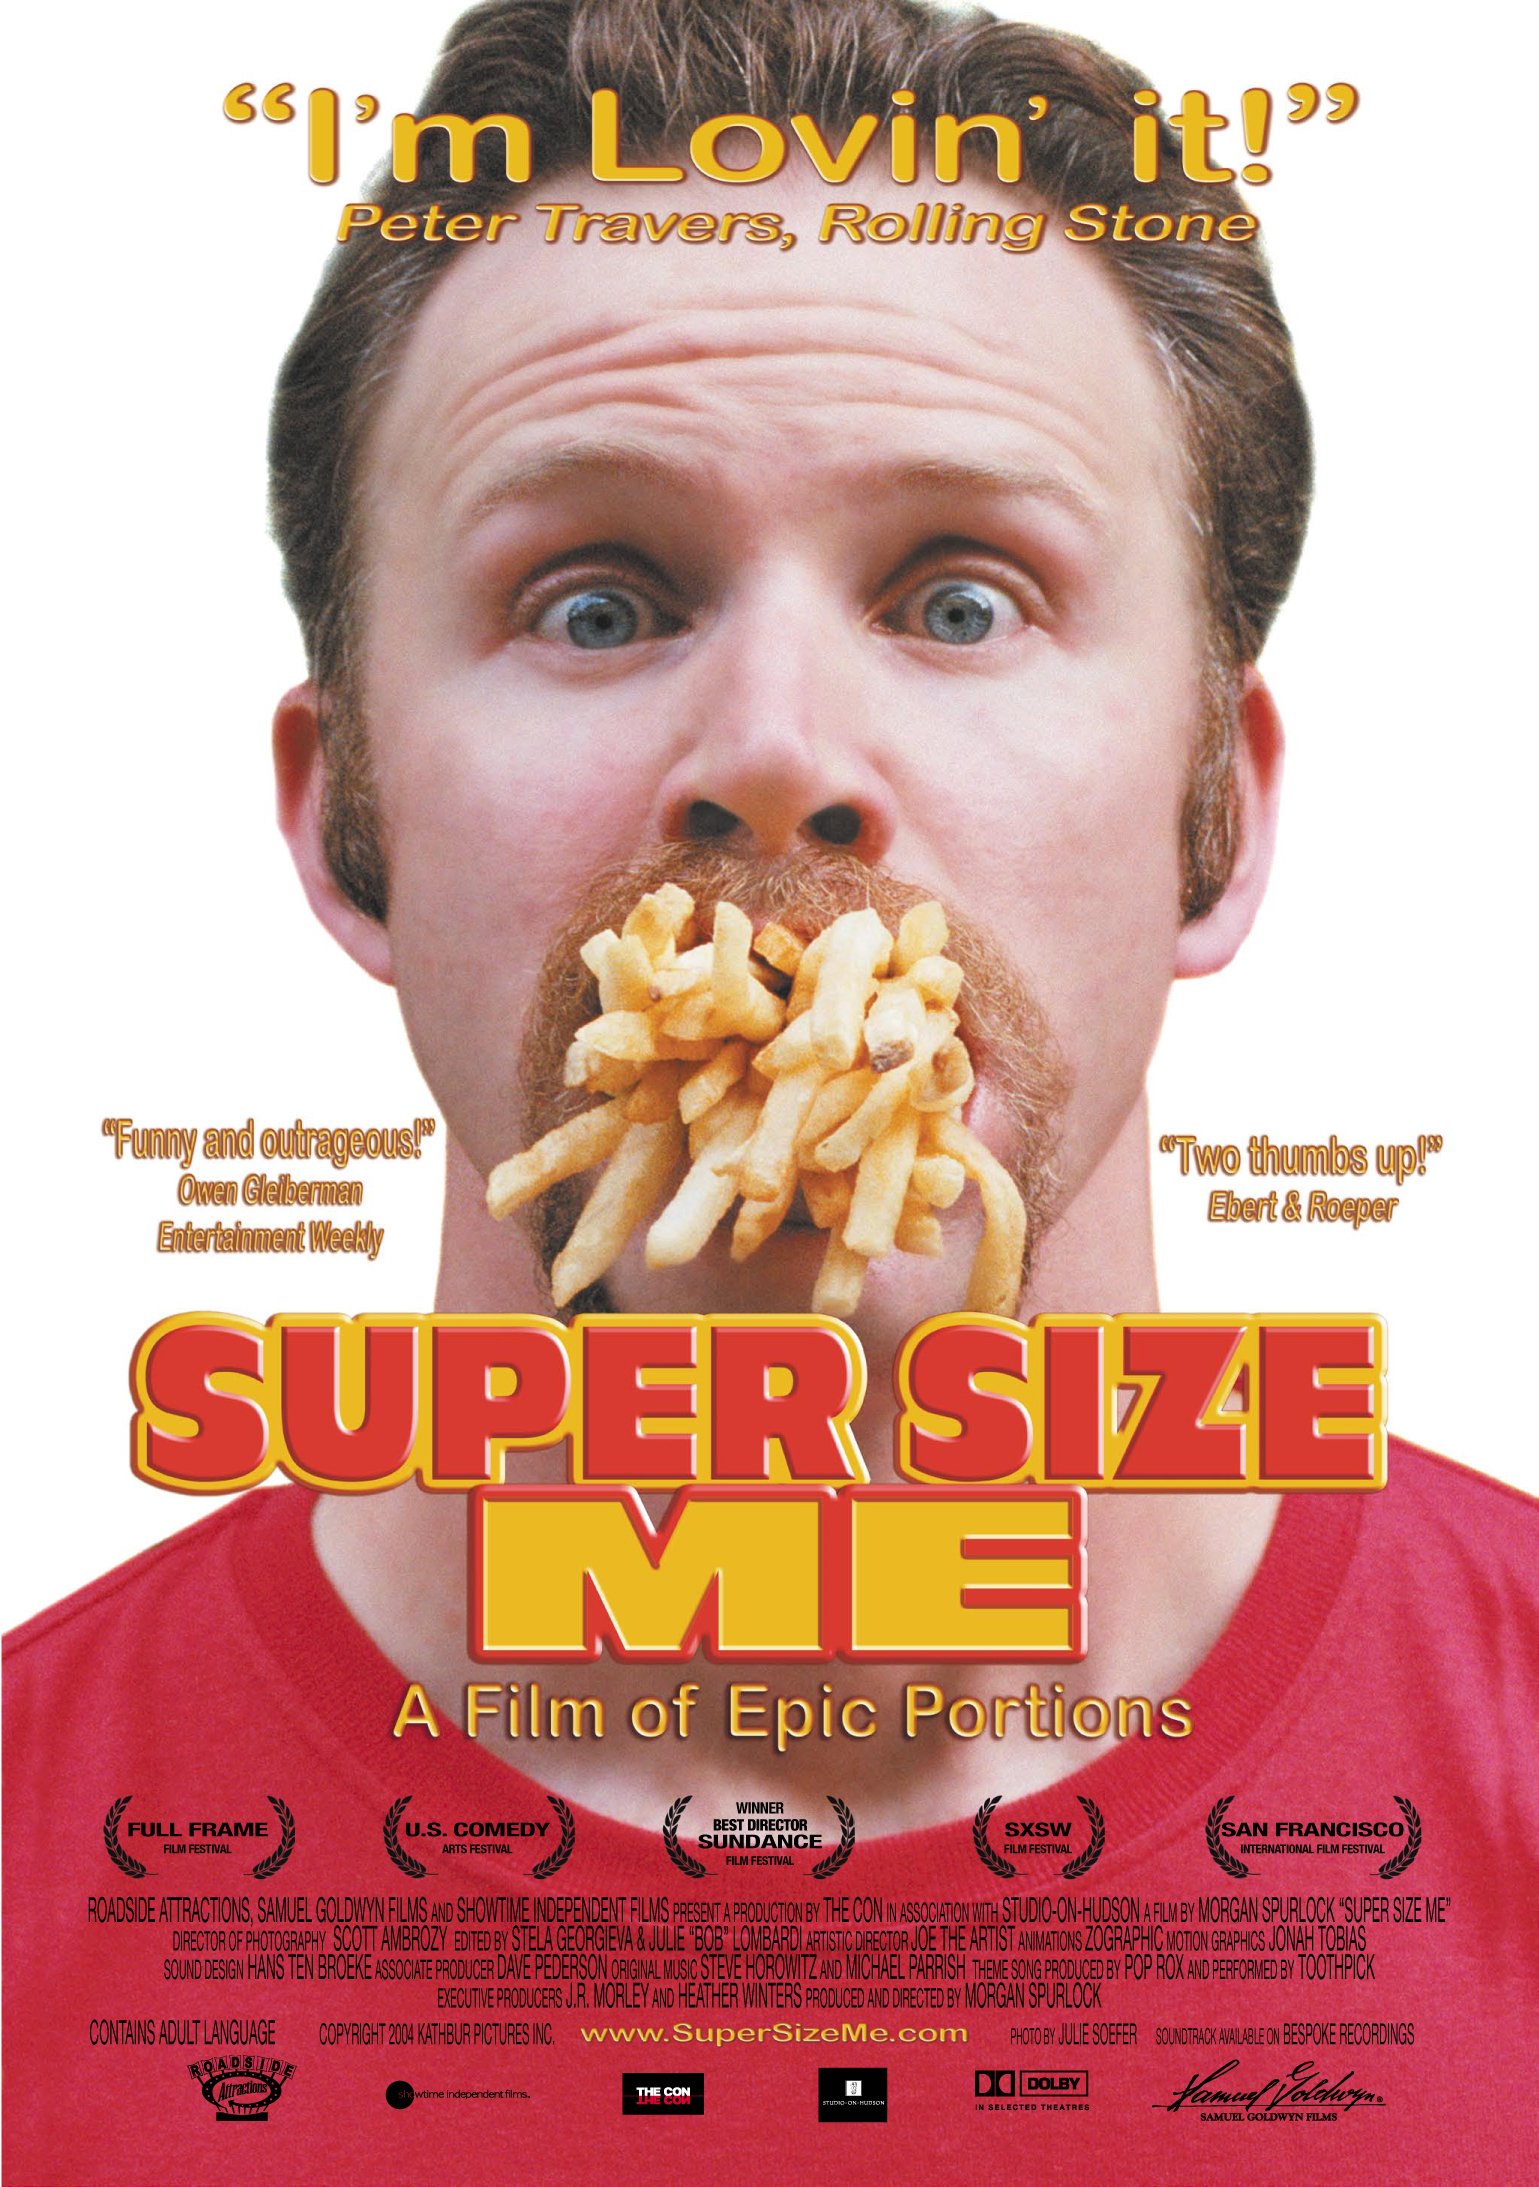
Task 1 - Supersize Me (2004)
Watch the opening sequence of Supersize Me - a documentary film from 2004. Spend 10 minutes researching the film and create a brief fact sheet about the plot. You can use these prompts as your starting point.
Here is a review site for the film.
Task 2 - Watch this short video about a different sort of Malnutrition.
You will study the impacts of malnutrition on children in some of the poorest countries in the world (LIC's) but what about in the richest countries ( HIC's)?
Does malnutrition exist there in a different form?
Then check out this article from the Guardian.
Read the article linked above and make notes on the impacts of eating the wrong (french word: mal) sorts of foods in large quantities.
Extension Task - Create a 1 side of A4 factsheet on Word or PowerPoint about obesity. You should include:
1. The causes
2. The effects (same link as above)
3. The countries most affected - link
4. Why the Pacific Islands have such a problem - link
5. One map & one image.
Task 3 - Use the video below to make notes on the problems caused by food waste around the world? Is it acceptable that food waste is a 'thing' despite many millions of people in the world who go hungry every day?
Add a second slide to your obesity PowerPoint entitled 'Food Waste is the World's Dumbest Problem' and outline the message from the video below. Try to include data and places in your slide(s).
Task 4 - Of course, it isn't just food that can be consumed in excessive quantities. Drinks can too. In particular soft drinks like Coca Cola. Watch the video below that contains some shocking details about the consumption of Coca Cola in some communities in Mexico.
Use the note taking framework below to take notes as you are watching 24 minute documentary. There are some quite shocking parts of the video, so beware!
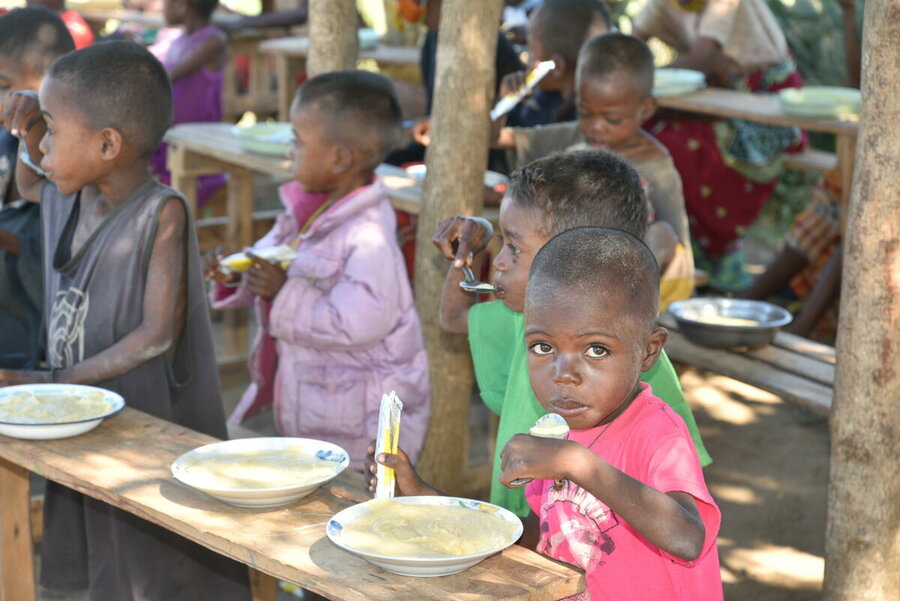
A World Of Hunger?
Hunger is worsening worldwide. As many as 828 million people — about 10% of the global population — regularly go to bed hungry. Economic shocks, extreme weather events, and conflicts like the war in Ukraine have restricted global food supplies, driven up prices, and presented a threat to vulnerable populations and countries.
|
|
|
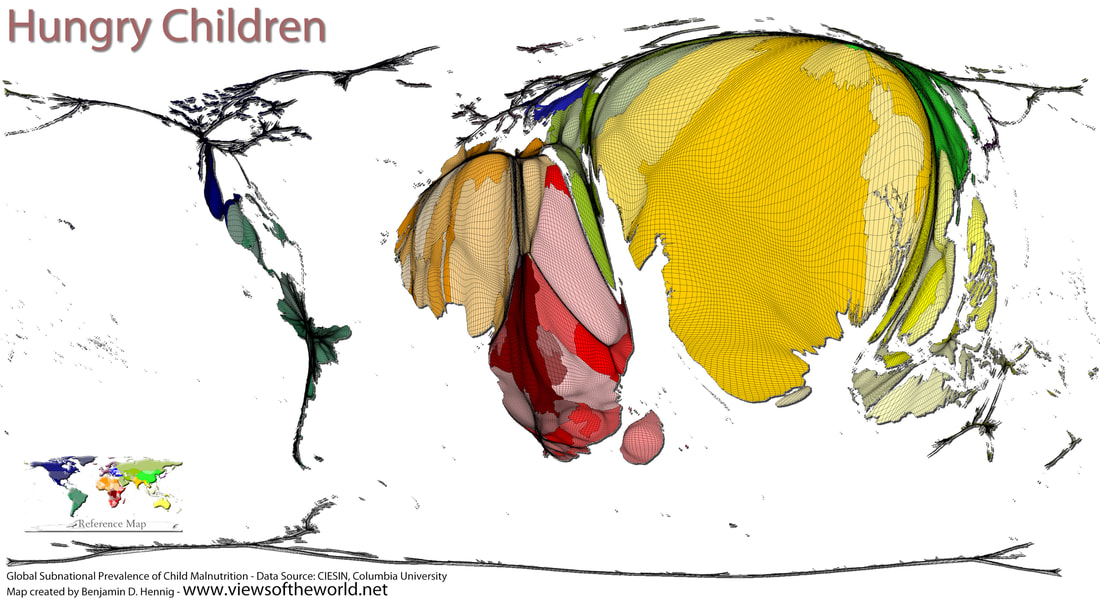
Task 1 - Using the resources above, and this link, complete a fact file about the problem of hunger in places around the world. Use the template below to structure your work.
So, how do we feed a future 11 billion people?
|
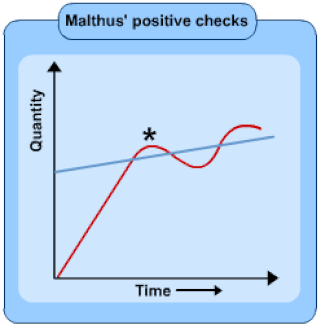
Pessimist - Thomas Malthus
1766-1834 
Malthus was writing at the end of the 18th century. He believed that only bad could come from population growth. Population, he said, grows faster than food supply. He said this was because food supply could not possibly keep up with population growth. Remember, this was back in 1798 and agriculture was very different from nowadays.
|
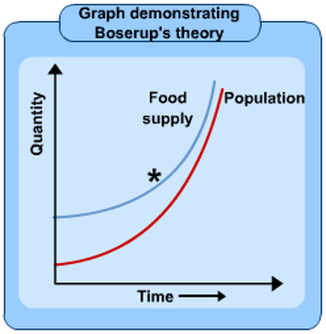
Optimist - Ester Boserup
1910-1999 
Boserup said that food supply would increase to accommodate population growth. As a populations found that they were approaching food shortages they would identify ways of increasing supply whether through new technology, better seeds or new farming methods. Today this can be seen in GM and high yield variety crops.
|
Starter: Read the information above carefully and study both graphs.
Task 1 - Define pessimist and optimist.
Task 2 - Use the information above and also carry out some more research to create an A4 fact file on both of the people above. You should include the following:
* Name & when alive
* Photo / Portrait
* Their beliefs (how does population link to food supply)
* A graph to show their beliefs (above).
* One reason to believe what they said
* One reason to disbelieve what they said.
* A recent news story headline that proves that each was right. (Boserup 2021 story & Malthus 2021 story in French)
Task 3 - Listen to the BBC Inquiry Podcast Below - How can we feed 11 billion people? Take notes on the worksheet below.
Population & Food - Mini Assessment
|
This task should take you approximately 2-3 hours to complete. It will be graded and results will be shared with you and your parents. It is a summative assessment that shows me how much you have understood of what we have learnt so far.
Assessment Task - So, which side are you on? A Malthusian or an Anti Malthusian (Boserup)? Produce a 500 word essay (with images) to explain who you support and justify your decision with facts, data and recent news events to prove your point. You could watch the two videos below to help you understand the issues a little more before you start. Suggested Structure: 1. Introduction Describe the two opposing viewpoints to food supply & population growth (Malthus & Boserup). Use graphs to help your explain the relationships between population growth and food production (see above). 2. Problem Food What are the food types that are problematic to our planet & our people? (this 5 minute video is excellent). 3. Population Growth Describe historical and future global population growth (this graph will help). 4. Feeding 11 Billion People Describe and explain the problems in trying to feed up to 11 billion people. Name two places in the world where food shortages are already a problem (BBC Inquiry podcast notes) 5. Future Food How might our future food change? Give one example of how we might use technology / science to keep up with demand and two examples of future food types (BBC Inquiry podcast notes & videos below) and how they could meet our nutritional needs. 6. Conclusion Now tell me what you thoughts are. Are we in for a food revolution or for mass starvation? Are you a 'Malthusian' or an 'Anti Malthusian'? Formal Requirements a. A title page with the name of the investigation 'Malthusian or Anti Malthusian - A report by *your name*'. Add a suitable image, your name and the total word count b. A contents page c. Number your pages d. References page e. Any images or graphs should have a caption (title) and a figure number. |


|
|
|
|
Food Distribution -The Cake Game
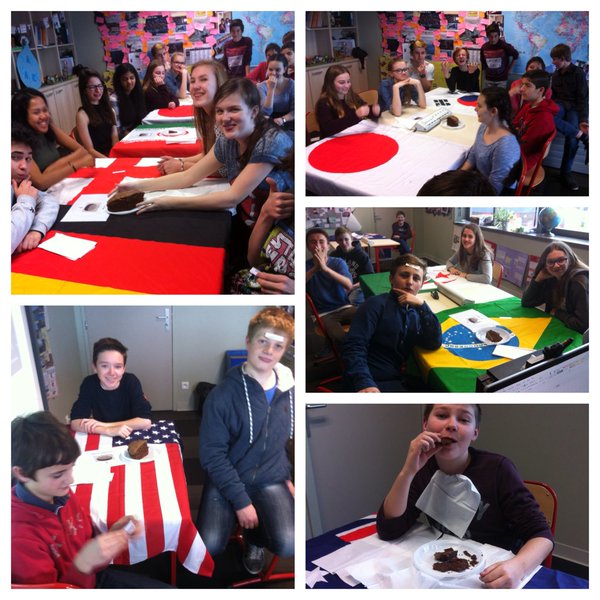
Europe with nearly 1/3 of the whole cake!
Objective: To find out about the inequalities that exist with the supply and provision of food in the developed and developing world (and to eat some cake)
Lesson Plan
PowerPoint
Table Labels
Chance Cards
Continent Cards - To be picked out by each student
How to divide up the cake
This takes some organisation and just about fits in to an hour lesson.
Lesson Plan
PowerPoint
Table Labels
Chance Cards
Continent Cards - To be picked out by each student
How to divide up the cake
This takes some organisation and just about fits in to an hour lesson.