
Global Population Growth

Objective: To study population change over the last 150 years and to identify future trends.
You may use this worksheet.
Starter: Each student must make a prediction on the following population features:
1. How many more people will there be in the world by the end of the lesson?
2. How many more people will be infected with the HIV virus?
3. How many species will have become extinct?
4. How many tonnes of CO2 will have been released?
Write your predictions in your exercise book. We'll check back in an hour

Task 1 - Study the face above. On your worksheet, write down who you think this person is and perhaps write a little bit about him/her. What nationality? What age? Why is the image so grainy? Worksheet here.
|
Task 2 - Watch the first two videos above, noting down as many facts as possible on the face worksheet in task 1. Discuss the issues that are present in 2012. Will life be the same in 2112? What might change?
Task 3 - World population growth. Watch the third video down first ,taking some notes. You will be completing a piece of work from geographyalltheway.com. Click here to be taken to the relevant section of the site. Link with GCSE French - Plug in your headphones and navigate your way through this animation making notes as you go. Task 4 - Imagine you have to predict life in the year 2112. Have a read through these predictions for what life could be like in 2112 to get some inspiration. Write four tweets of 140 characters or less to explain your thoughts on the areas listed below. Use this classtools application. Try to think of four people who would have a view on world population growth (famous or even you!). See this example and there are further examples embedded below. Tweet 1 - Population trend in 2112 Tweet 2 - Powering our planet Tweet 3 - What languages will we speak Tweet 4 - Life in your home country Save each of the tweets as a PDF (options at the bottom of the tweet). Email your best one to Mr Podbury or post on the Facebook fan page and they could be featured on this site. Task 5 - Study this PowerPoint carefully and make notes from slides 3-5. |
Task 6 - Video Below |
|
Task 6 - Watch the 45 minute video to the right hand side - How Many People Can Live on Planet Earth?
Use the sheet below to complete the activities during the video. The activities are in chronological order. Print out the sheet and work on it in front of the computer/TV as you watch the documentary. |
|
So why has world population growth slowed down?
1. Contraception - People are now able to choose when to have children (family planning)
2. Lower fertility rates - Parents realise that their children will survive past their first birthday due to medical advancements
3. Anti-Natalist policies - One Child Policy in China aimed at cutting the fertility rate to below 2
4. Career Women - Now deciding to postpone starting family to focus on forging a career path and earning money
5. Children cost a lot! - I can cost up to $200,000 to bring up a child until he/she turns 18 years old!
Check It Out! - Where People Live
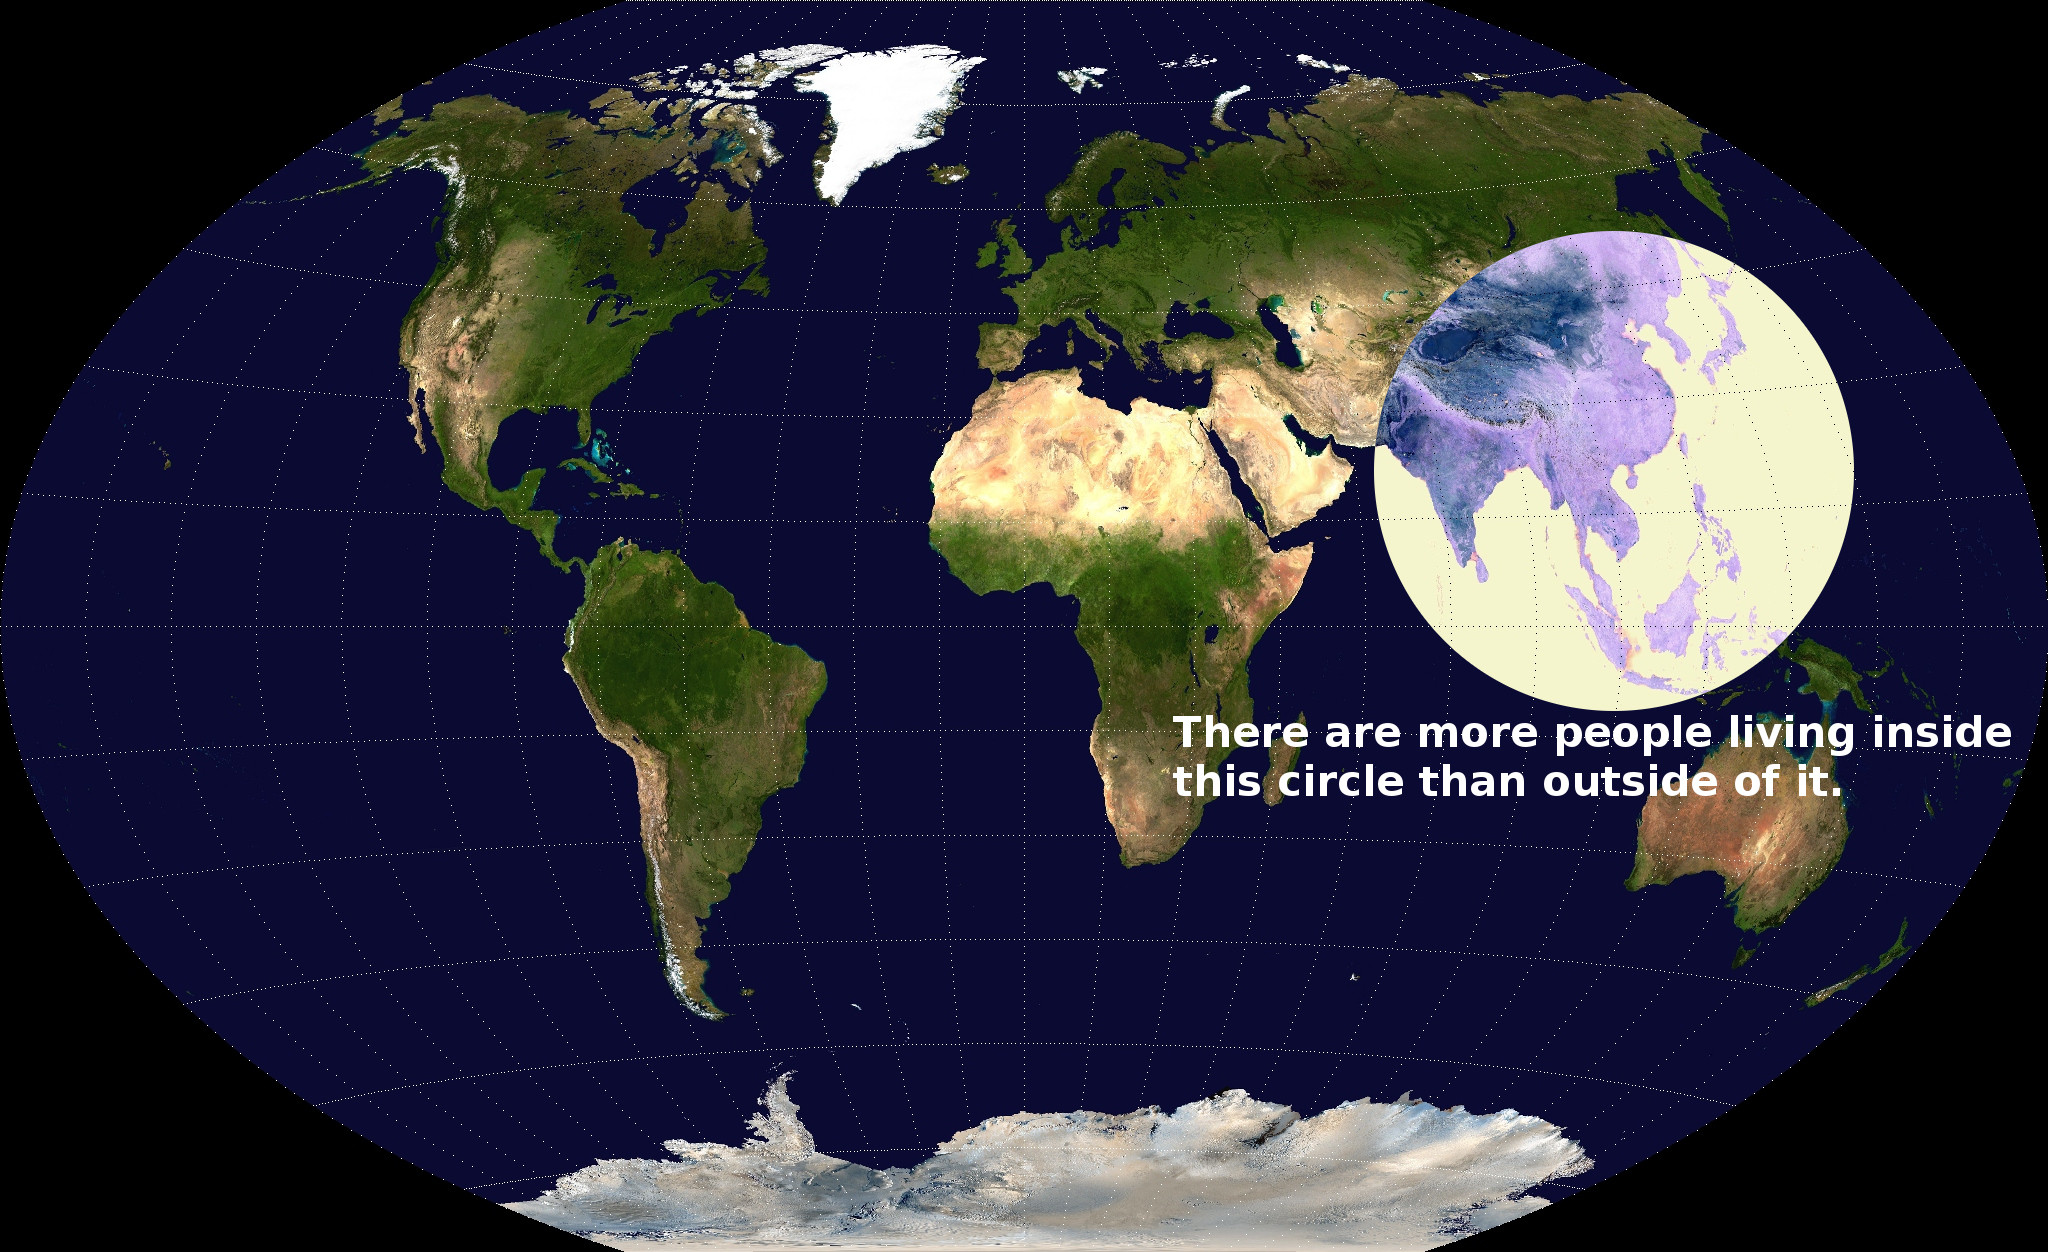
Don't believe everything you see though. This is the visualization, but we have to check it out. The countries in the circle are .
China: 1,349,585,838 people (per the Census again)
India: 1,220,800,359
Indonesia: 251,160,124
Bangladesh: 163,654,860
Japan: 127,253,075
Philippines: 105,720,644
Vietnam: 92,477,857
Thailand: 67,448,120
Burma: 55,167,330
South Korea: 48,955,203
Nepal: 30,430,267
Malaysia: 29,628,392
North Korea: 24,720,407
Taiwan: 23,299,716
Sri Lanka: 21,675,648
Cambodia: 15,205,539
Laos: 6,695,166
Mongolia: 3,226,516
Bhutan: 725,296
… which adds up to a grand total of 3,637,830,357, or roughly 51.4 percent of the global population of 7,083,460,000 (May 2013)
Population Distribution
Objective: To describe the factors influencing the density and distribution of population
Study the map to the right hand side carefully. It shows an alternative view of the world based on population distribution. The more inflated the country, the more people live there and visa versa.
Open a new word document and copy the title and objective from this section.
Task 1 - What does Population Distribution mean?
Task 2 - What does Population Density mean?
Task 3 - Copy and paste the map above into your Word document. Add a suitable title and write a detailed description of the distribution of the worlds most populous countries. Try to identify countries that have swelled hugely and those that have almost disappeared. Name your home country and describe its new shape.
Map of the world - inflated to show high populations numbers & deflated to show low population numbers.
Distribution of
Starter: World Mega City Mind Mapping. Students view this map of the distribution of world mega cities for 90 seconds. They then turn over their blank map and plot the locations remembering names, locations and add a key.
What is a mega city? Find a suitable definition. Perhaps go to the 7 Billion video above and scroll along to 1 min 19 seconds. Does this help? Task 1 - Study the map below carefully. It shows population size and 5 to +10 million population mega cities. A swelling in a country away from the mega cities indicates that many people live in rural (countryside) areas. Can you name three countries where this is the case? A squeezed country with mega cities indicated would suggest that few people live in rural areas and most would live in the urban areas (towns & cities). Again, can you name three countries where this happens? Task 2 - Click on this Wikipedia link. Work out the total percentages of mega cities by continent and show your result as a pie chart Task 3 - Comment on the top three cities in terms of their growth rate. Look at the top three cities and work out how many more people arrive there each year. Divide that by 365 to get the daily arrivals number. Surprised? |
|
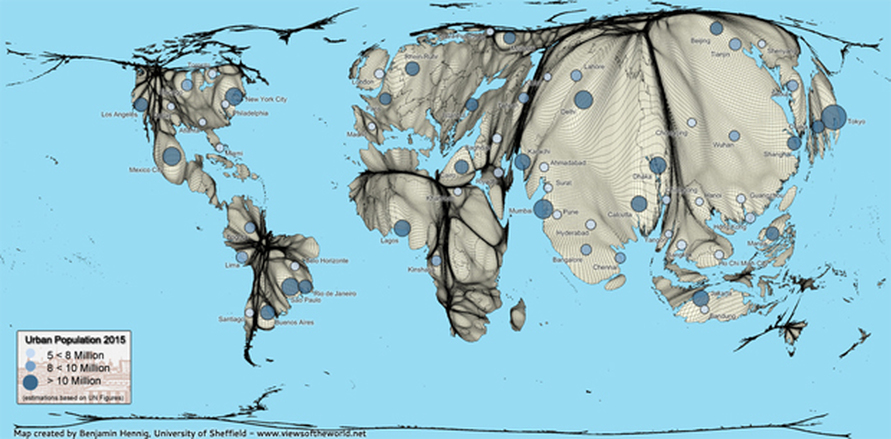
Thanks to the University of Sheffield & Ben Hennig
Task 4 - Download and Mega Cities Worksheet below (Blue Tab) and complete pages the exam style questions on page 1-4 only. Do not print this out yet as we will have to come back and finish the last case study later in the course.
Homework. Spend 20 minutes exploring the world of Mega Cities through this excellent Guardian interactive resource. For A* - B grade students, you should also spend one hour watching the excellent BBC documentary below taking additional notes.
Stop Check - Population Key Words & Definitions
Objective: To recognise and define six key population terms and to be able to use the CIA World Fact Book to search for up to date and reliable data.
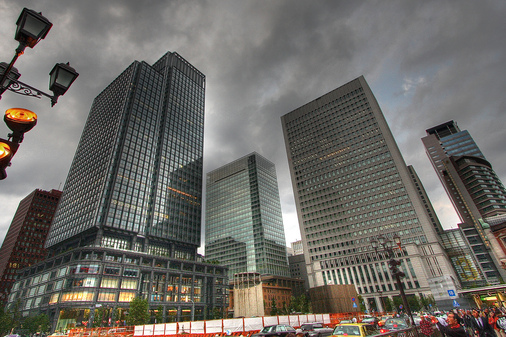
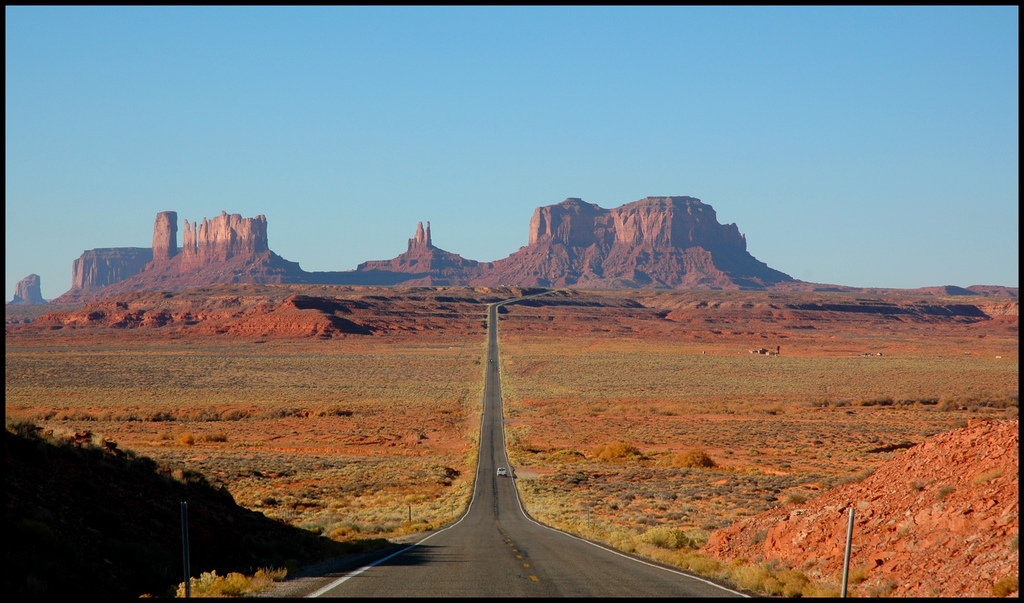
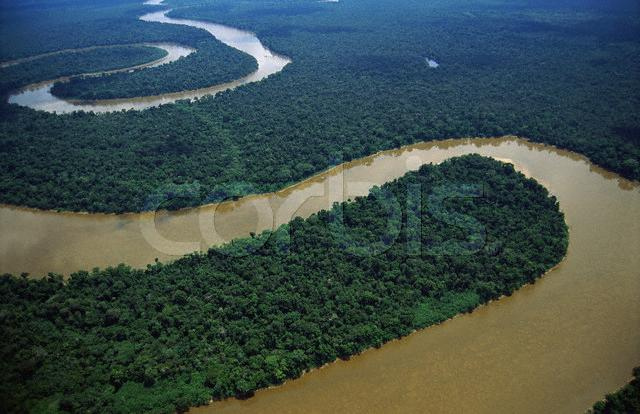
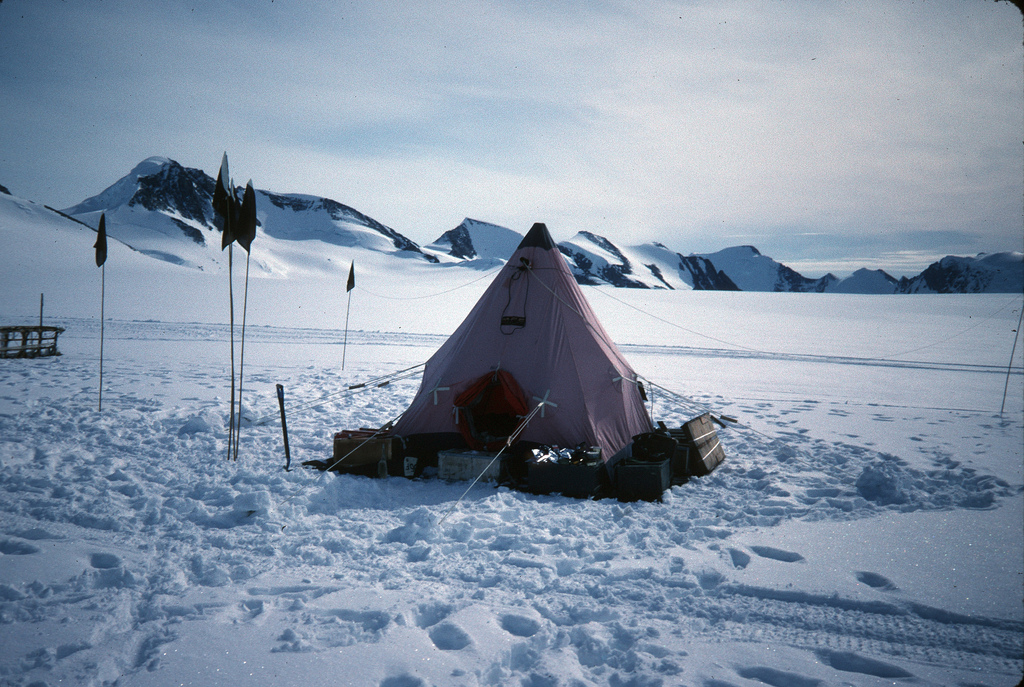
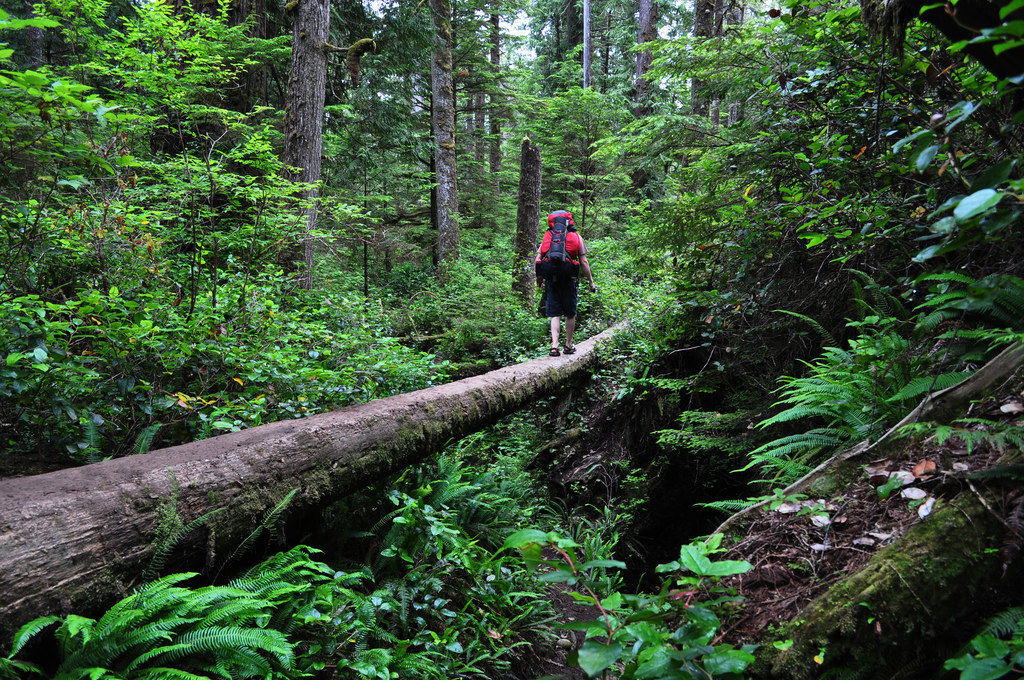
Why are some places crowded & others empty?
Objective: To find out what physical factors lead to densely and sparsely populated areas of earth.

|

|

|
Starter: Click on the photos above and study them carefully. Choose the photo that you are drawn to and copy it into a Word Document. Annotate it with as much information as possible. Include what is this? who are these people? where in the world is this? why is it like this? would I like to live here?
Source
Source
|
Population density is normally worked out using the following formula:
Total Population / Total Land Area = Total Population Per Square KM. Densely populated areas are where many people live and sparsely populated areas are where few people live. Task 1 - Choose two of the images to the right hand side that show areas of the world that have low population densities. Copy and paste them into a word document with the title and objective above. Annotate all the reasons why these areas are sparsely populated. Where in the world do you think your photo was taken? Add a feature e.g. desert, and location e.g. the Sahara. Making the link -Physical Factors affecting Population Distribution Task 2 - Using a printed copy of the 'Population 2 - worksheet (click button - below to download) and an atlas/Google Earth, follow the instructions carefully. |


|
Global Population Distribution