The Global Rich List

Objective: To find out how big the gap between rich and poor is and to work out our placing on the global rich list
Lesson plan - Introduction to Development - Teacher Resource
Task 1 - Watch the Teenage Affluenza video beneath. Why is this shown right at the start of a unit on development? How does this affect our approach to viewing the world?
Resource 1- PowerPoint - Introduction to development and the Global Rich List (Slide 1-6)
Task 2 - Watch the two other videos beneath. MTV Cribs and the Make Poverty History Campaign. Fill in this sheet with your responses. Will we all ever be able to live exactly the same? What things prevent this from happening?
Task 3 - Each student should work out how much their 'earn' each week. This could include paper round money, pocket money or even the value of birthday and Christmas gifts /52. Come up with a value and then share with the class. An average value should then be taken and multiplied by 52 to give an average yearly wage for the class.
Enter the data here (whole pounds/euros only. No pennies or cents) into the world wealth calculator or alternatively, you could try this BBC site.
Students should take a note of where they are and their global positioning. How many of the worlds' population is still poorer than them? Where do they expect to be in 10 years time. Provoke discussion.
|
|
|
|
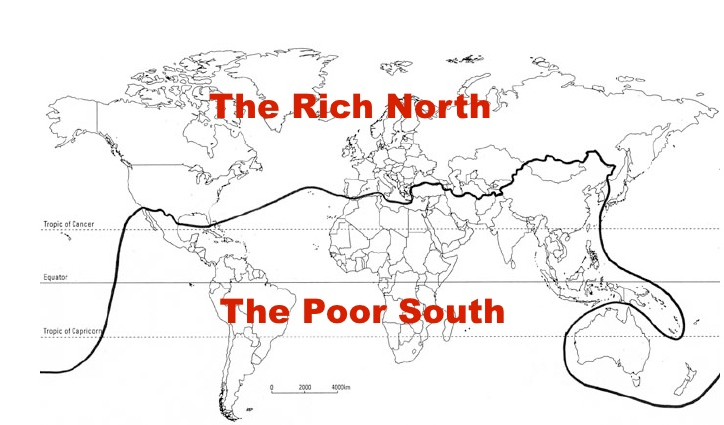
Task 4 - So, how does wealth and development vary across the world?
The world has traditionally been divided into two. The Rich North & The Poor South. This was called the Brandt Line. Any country above this line was developed and wealthy and anything below was less developed and considered to be poor. But, how relevant is this line today? Click on the blue tab below to access a worksheet that contains your task. |
Measuring Development - HDI League
(Norway & Sierra Leone)

Objective: To find out what HDI is and how is it calculated? To look for and to explain patterns in HDI around the world.
Open a new word document and give it the title above. Copy and paste the objective and add today's date.
Teach a friend - Working in pairs, add a table with two rows and two columns. Spend 5 minutes compiling a fact box on either Norway or Sierra Leone. When complete, share your facts with your partner and they can fill in their table with information
Read page 182 & 183 of New Wider World.
Task 1 - Answer the following questions:
1. What does HDI stand for?
2. Name the three composite indicators that are included in HDI.
3. On what scale is HDI measured?
4. Which is the highest and lowest value?
5. Give examples of values and what those represent.
Task 2 - Click here to be taken to an interactive world map and graph of countries linked to the HDI rating. Individually, click on Sierra Leone, Norway, France and your home country (Spain, Germany etc). Describe the trends shown on the graph that opens up making sure you talk about the value in 1980 and the value today as well as the shape of the line and anything unusual that happens.
Task 3 - Go back to those individual country databases. Click on the country on the map and then add the data for 'life expectancy', Mean years of schooling' and 'GNI per capita' (income per person) to your map.
Task 4 - Look carefully at the line graph at the bottom of the page. What is the pattern of HDI compared to the rest of the world. Write no more than 30 words to describe for each of the three countries.
PowerPoint - Sierra Leone and Norway Comparison
|
|
|
optional work - project
MDG's (2000-2015)
|
Starter - Watch the video to the right hand side and make a list of the eight goals in order in your book.
Task 1 - Go to this website that covers each of the eight MDG's and add it to your 'Favourite Bar' Task 2 - You will be split into eight groups. You must study the relevant Goal section of the website in task 1 and also download the relevant fact sheet below. Task 3 - You will have one hour to thoroughly research your goal and to practice your five minute presentation. You must cover the following:
a. Name, number & logo of Goal (use same colour scheme) b. Two facts about the Goal & why it was set c. Two targets associated with the Goal. d. Where do we stand? - Click on 'Progress' on the website. e. Two named places and examples of where progress is being made. f. Still to do - click on the 'to do' tab on the website. For large groups You will be given five minutes to cover your goal with the aim of educating the audience about the goal and covering tasks a-e above. You should also produce an A5 fact sheet to take away and use for revision for the end of year exams. Or For Small Groups - The Speed Dating Process Goal teams 1, 2, 3, 4 will present to Goal teams 5, 6, 7, 8 and will work their way down the line. You will have 3 minutes to get through your speech and impress the other side. Romantic music will be playing throughout to add to the occasion! Each group must record their date information on a sheet and then give their opposite partner a grade out of 10 - where 1 = No hope to 10 = Love at first sight! Recording sheet can be found here or on the tab below (enlarge to A3). |
How does Speed Dating Work? |
Millennium Development Goals - After the Speed Dating.....You are now in the position to be able to have an overview of seven of the eight MDG's, where we are in 2014 and the progress with each.
Task 1 - You task is now to draft a letter to Ban Ki-Moon (Head of the United Nations) outlining at least one of the MDG's that you are most interested in (one could be your specialist + another one you found inspiring) and providing a summary of where we are in 2014 in terms of meeting it. Use your recording sheet from the speed dating exercise and the fact sheets above to improve your knowledge. After all, you are writing a letter to the number one expert in the the world! This letter can be sent to the UN as an email if you meet certain quality criteria. See the instructions below |
Moon's Greatest Hits!
|
|
Suggested Structure. Target 500-600 words
Dear Sir I am a student at the International School of Toulouse, France. In our geography lessons, we have been studying the disparities that exist between different parts of the world and how the Millennium Development Goals are working to try and reduce these. I am particularly interested in Goal number * which is ___________________. I understand that the following targets have been set (explain why each is important) I can see that the best examples of this happening are in (name place) where ____________________ has happened (give further detail & explain how this helps to meet the goal) In June 2014 we are ______________________ (explain where we stand at the moment) I am concerned that there is still work to be done particularly in _________________ (name and state areas where work urgently needs to be carried out) I conclude that we are likely/unlikely to meet this goal that was set in 2000 and I hope that we can ___________ Yours faithfully Primary Education - 1GOAL! |
|


