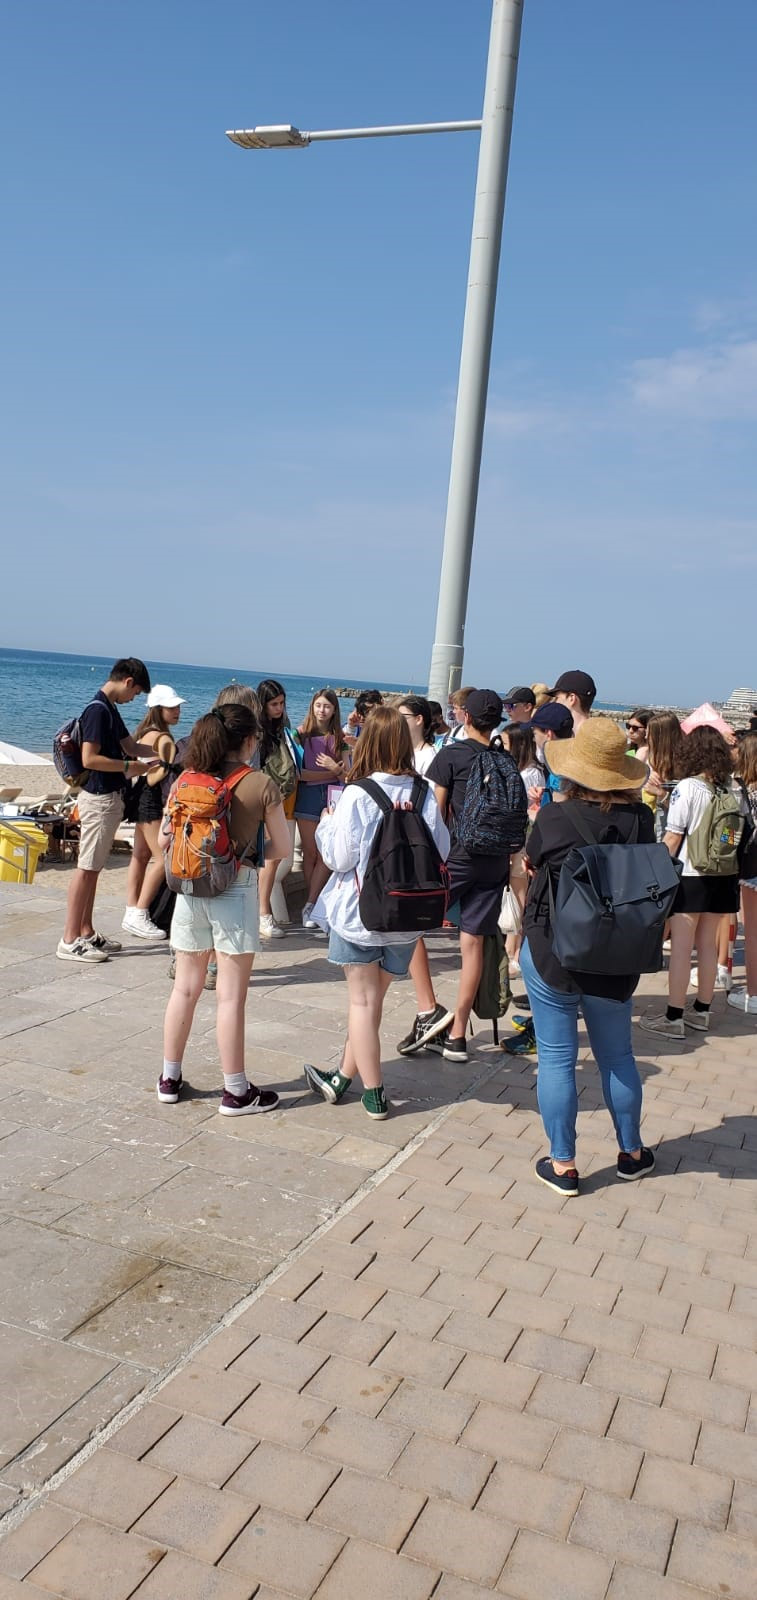
How have geomorphic processes altered the coastline in Sitges &
how have people tried to manage these processes?
how have people tried to manage these processes?
Essential Resources
|
Chapter 2 - Methodology Word Count 300 Deadline: Monday 1st July 2024 You are going to be writing up your methodology in table format. You must be precise and detailed in your descriptions to be able to access full marks on this section. |
Here are the methods that you used in Sitges:
1. Beach profile (this splits into several parts)
Width and length
Paste a copy of the data collection table for beach profile into your methodology.
Why do this method? The width of the beach (from the sea wall to the swash zone) indicates the extent to which the beach is being protected successfully or to what extent it is being eroded away by waves and the process of LSD.
A narrow beach might suggest that the groynes are not working and material is being moved from the beach by a mixture of LSD and destructive waves. Beaches where the swash zone touches the sea wall could be the biggest indicator of erosion.
A steep beach might indicate that destructive waves are in action. Stronger backwash than swash - pulling material into the sea.
2. Longshore drift data
This is where you measured the distance (in metres) from the top of the groyne down to the surface of the beach. You did this on both sides of the groyne and the idea was to see which side of the groyne was higher than the other.
A higher beach on one side indicates that there is more sand. This means that the sand is being piled up by LSD and should therefore show the average direction of the process.
3. Bi-Polar analysis of sea defences
You need to put a copy of the table into your methodology.
You carried this three/four times on three different types of sea defences. You need to explain what the positive and negative scores refer to. What would a higher number mean and what would a lower number mean. Particularly important if you are looking at erosion or how well the defences in Sitges work.
4. Field Sketches of unprotected beach past the nightclub.
You used a template to sketch the features of a hard rock headland. It was too hot to walk down to the pebble beach, so we will do this from the classroom using photos that I took last year.
5. Photos & other observations
Don't forget to say that you took a selection of photos as you were carrying out the fieldwork. The photos help you to remember the methodology and to remember characteristics of the different sites you visited.
A list of equipment that you used can be found on the right hand side. It is important that you use the right names in the methodology.
To avoid the tight word count, we are going to avoid this by putting the methodology into a table. Click on the button below to be taken to an example crib sheet.
You may also include some annotated photos on a separate page to show you carrying out the methods in the field (your photos)
Names of the different equipment used in Sitges field study
Here is a list of the equipment that you used on the Sitges study. You need this information for your methodology.
Beach profile measuring
· Ranging Pole
· Clinometer and support pole (with spike on)
* Telescopic Ruler
· Measuring Tape
· Camera to take photos
· Table in work booklet to record data
Coastal Defences
· Camera
· Bi Polar Evaluation technique
· Assessment of coastal defences at Sitges
Field sketches
· Pencils
· Outline sketch sheet
Checklist before final hand in
- Contents Page
- All pages numbered
- All photos, graphs, charts etc numbered in order e.g. fig 1, fig 2 etc
- Header of your name & Candidate Number
- Footer of International School of Toulouse FR042
- Front Cover with the following:
How do geomorphic processes affect the coast in Sitges, Spain?
Your Full Name
International School of Toulouse
FR042
An Image
Paper 3 - Coursework
IGCSE Geography 0460
Word Count (should be no more than 2000).


