Introduction to Freshwater
|
Just how much water is there?
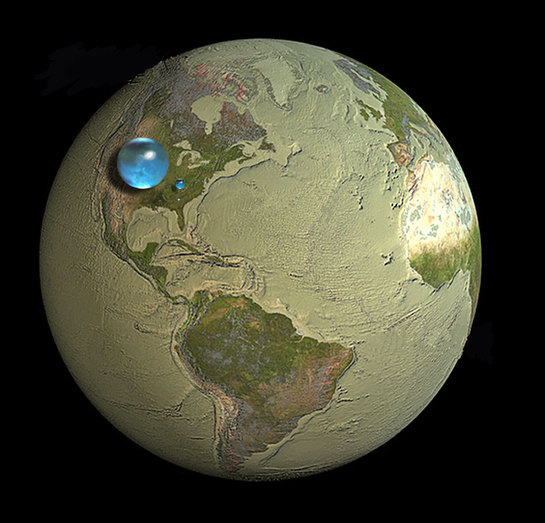
Use this worksheet to summarise this info The drawings below show various blue spheres representing relative amounts of Earth's water in comparison to the size of the Earth. Are you surprised that these water spheres look so small? They are only small in relation to the size of the Earth. These images attempt to show three dimensions, so each sphere represents "volume." Overall, it shows that in comparison to the volume of the globe the amount of water on the planet is very small - and the oceans are only a "thin film" of water on the surface. The largest sphere represents all of Earth's water, and its diameter is about 1400km. It would have a volume of about 1,386,000,000 cubic kilometers (km3). The sphere includes all the water in the oceans, ice caps, lakes, and rivers, as well as groundwater and atmospheric water. Liquid fresh water How much of the total water is fresh water, which people and many other life forms need to survive? The blue sphere over Kentucky, USA represents the world's liquid fresh water (groundwater, lakes, swamp water, and rivers). The volume comes to about 10,633,450 km3, of which 99 percent is groundwater, much of which is not accessible to humans. The diameter of this sphere is about 273 kilometers. |
Water in lakes and rivers
Do you notice that "tiny" bubble over Atlanta, Georgia? That one represents fresh water in all the lakes and rivers on the planet, and most of the water people and life of earth need every day comes from these surface-water sources. The volume of this sphere is about 93,113 km3. The diameter of this sphere is about 56.2 kilometers. Yes, Lake Michigan looks way bigger than this sphere, but you have to try to imagine a bubble almost 55 km high—whereas the average depth of Lake Michigan is less than 91 meters. Source USGS - Click here for the full link |
The water system
Objective:
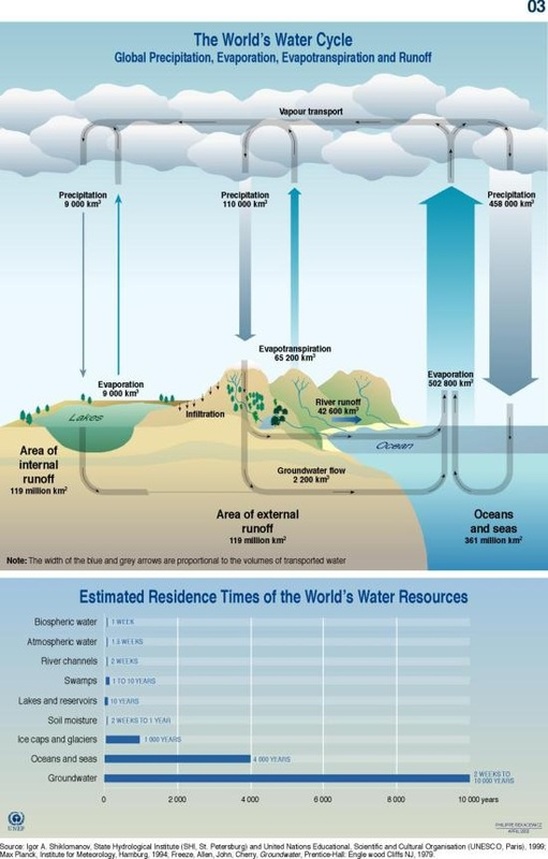
Examine the inputs, outputs, stores and transfers of the hydrological cycle. Background - Read the embedded slideshare to the right and make notes on open and closed systems. Task 1 - Complete the blank water cycle diagram sheet provided by geographyalltheway.com. Click here to access the page. Make sure you include all of these labels. Task 2 - Complete all tasks on The World's Water worksheet based on the model to the right. Water Balance Video - Sea/Ice
Objective - Discuss the causes and consequences of the changing balance between water stored in oceans and ice.
Task 1 - Click here to access a short tutorial page about the changing balance of water stored as ice and the sea. Watch the two animations carefully, take a screen shot of each and then annotate with the science behind the differences. Answer the following questions: i. What different environmental factors could be causing melting of the ice in the two tanks? ii. How has the melting of the ice affected the water level in both tanks? iii. By how much (in centimeters) has the water level in the tanks changed? Extra Reading: Study this article from New Scientist and this one too from phys.org (thanks Mr Cuthbert) Task 2. Click here to access a journal entry on the melting of the Greenland ice sheet. This is fairly technical stuff and would be used by students at university level. I would like you to summarise the article using the following headings:
a. Location b. Issue c. How is it measured d. Potential Effects |
IB Geography: Systems Approach View more presentations from geographyalltheway.com |
|
Water Balance
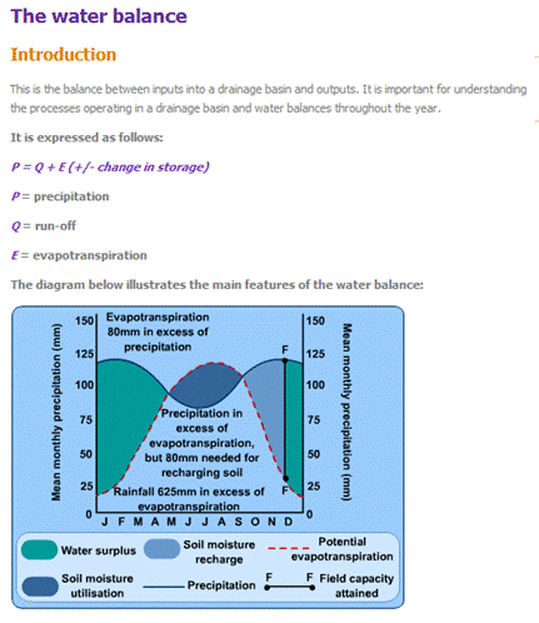
Objective: Explain the concept of maximum sustainable yield of freshwater in terms of a balance between inputs and outputs. Linking freshwater to the MDG's - BBC news report on freshwater leading to economic development Task 1 - Complete the following questions underneath a copy of this water balance graph: a. In which months is there a water surplus? b. Why is there soil moisture recharge in October? c. When is field capacity attained? d. Why is water deficit not shown on the graph? e. Explain the pattern of evapotranspiration on the graph. Is this a northern or southern hemisphere model? e. copy the information to the right .... Task 2 - Click here to access the geographyalltheway work on this section. Complete the graphing and the Maximum Sustainable Yield tasks fully. |
Copy the following information underneath a copy of the graph and the questions 1a-d.
Soil moisture Surplus: If precipitation exceeds evapotranspiration and the excess is not been used by plants. Deficiency: Evapotranspiration exceeds precipitation. Recharge: Replacement of water lost during drier periods. Field capacity The maximum amount of water soil can hold. A water surplus can result in wet soils, high river levels and run-off whereas a deficit leads to dry soil, falling river levels and possibly drought. Water Deficit Evapotranspiration is in excess of precipitation and any previously available moisture has been used, in soil moisture utilisation. |


