
Functioning of Drainage Basins
|
Objective: To analyse the functioning of a drainage basin as an open system with inputs, outputs, transfers, stores and feedback loops.
Starter: Watch the video to the right hand side and make notes on the following: i. What is a watershed/drainage basin ii. main functions of a watershed/drainage basin iii. how human action can influence the functioning of the system. Task 1 - Study the embedded presentation from geographyalltheway carefully. Make a copy of the two diagrams showing open and closed systems. Try to label the open system diagram with some of the features you noted in the starter activity. Further higher level definitions of systems can be found here Task 2 - Study the definitions below carefully and then copy and paste them into the correct column in the worksheet below. This site may help you (but try not to use it unless you are stuck!)
Task 3 - Click this link to access the GATW page for drainage basins.
i. Make notes on positive and negative feedback loops and try to give your own examples for each. ii. Complete the worksheet on the drainage basin system and then apply your knowledge to match up feedback loops with different drainage basin conditions. IB Style Question: Draw a labelled diagram to show the inputs, stores, processes and outputs of a drainage basin system. [4 marks] Definitions for Task 2
|
All rivers receive a water supply and the area of land this comes from is known as a drainage basin. The boundaries of the basin are known as the watershed and will usually be marked by areas of higher land. | ||
Percolation: When water travels from unsaturated ground into saturated ground. Interception: When an object (building, tree) stops precipitation reaching the ground beneath. Transpiration: Liquid water evaporating from vegetation. River discharge: Eventually most rivers enter the sea and discharge the river's flow into the sea. |
Groundwater flow: The movement of water through saturated ground. Channel flow: Water that is travelling in rivers or streams. Surface run-off (overland flow): When water travels across the surface of the earth Stem flow: When intercepted water then travels down the branches and trunks of vegetation. |
Evaporation: Liquid water from surface stores and rivers turning into water vapour (gas). Surface storage: Any water that is held on the surface of the earth e.g. lake or pond. Some surface stores like puddles may only be temporary. Infiltration: When water travels from the surface of the earth into the ground beneath. Groundwater storage: Water that is stored in saturated ground. |
Throughflow: The movement of water through unsaturated ground. Canopy drip: Intercepted water dripping off vegetation onto the ground. Soil-moisture storage: Water that is stored below the surface in unsaturated ground. Precipitation: Any moisture that falls from the sky e.g. rain or snow. |
stream Discharge
Objective: Define stream discharge. Examine its relationship to stream flow and channel shape.
I use Integrated Approach (Waugh) for this section of the work page 68-70. Starter: Watch the video to the right hand side and take notes from the sections on velocity, slope and discharge. Task 1 a - Outline the role played by friction in the flow of water b - Define the two types of water flow. c - Copy figure 3.15 (laminar flow) into your work book and label appropriately. d - What is the relationship between velocity and turbulence? e - Copy figure 3.15 (turbulent flow) into your work book and label appropriately. f - Outline and sketch the three main influences on river velocity. This will include diagrams 3.16, 3.17, 3.19 & 3.20. Task 2 - Copy & Complete the following sentences, deleting as appropriate •A river in a deep, broad channel, often with a gentle gradient and small bedload, will have a greater/lesser velocity than a river in a shallow, narrow, rock filled channel – even if the gradient of the latter is steeper. •The velocity of the river increases/decreases as it nears the sea •The velocity increases/decreases as the depth, width and discharge of a river all increase. •As the roughness increases/decreases, so does turbulance and the ability of a river to pick up and transport sediment. |
Key Words
Bed: The bottom of the river channel Bank: The sides of the river channel. Channel: The confines of the river, encompassing the bed and two banks. Wetted Perimeter: The total length of the bed and the banks in contact with the river. Cross-sectional area: The width of the river multiplied by the depth of the river. Because the depth of the river will vary across its width, an average depth reading is normally taken. The cross sectional area is normally given in m2. Velocity: This is the speed that the water in a river is travelling at. The unit of measurement is normally metres a second (m/s). River velocity can be measured using a flowmeter (pictured right), or more commonly by timing a floating object over a set distance (pictured left). Velocity is then calculated by dividing the time (seconds) by the distance (metres). Discharge: This is the amount of water in a river at a given point. Discharge is normally measured in cumecs (cubic metres a second). It is calculated by multiplying the cross-sectional area by the velocity. As you move from the source to the mouth, both the discharge and velocity of a river increases. 
Homework
Make a copy of the Bradshaw Model as shown in the presentation to the left hand side. Mount it in the centre of a piece of A3 paper. Annotate each of the factors to show why they increase or decrease as you move from the upper to lower course of the river. Exam question (10 minutes) Explain the relationship between stream discharge and channel shape. (5) |
Interpreting Hydrographs
|
Objective: To describe the characteristics of a hydrograph. Analyse the reasons for spatial and temporal (short term and long term) variations in hydrographs.
Starter: Watch the first video to the right hand side. What factors affect the shape of the yellow graph? Background: There are eight key controls that affect drainage basins and ultimately the shape of the resultant flood hydrograph: 1. Basin size, shape and relief 2. Types of precipitation 3. Temperature 4. Land use 5. Geology 6. Soil Type 7. Drainage Density 8. Tides and storm surges These eight controls should not be viewed in isolation to one another. It is rare that just one of these control mechanisms would contribute towards a major event in a drainage basin. They should therefore be viewed as an interacting set of factors that contribute towards the behaviour of the basin. Task 1 - Use page 62-63 of Waugh – Integrated Approach to make notes on the 8 key DB factors. Where possible, try to find an example (photo, graph or quote) to further illustrate the point. Task 2 - Go to the GATW site by clicking here and complete the living graph activity. |
Hydrograph Time Lapse VideoTask 3 - Open Geo Factsheet n.o 83 from January 2000 and complete the activities on the last page (subscription required).
|
The Pakistan Floods of 2010
Your Tasks:Objective: To examine the role of hydrographs in forecasting the magnitude, spatial extent and timing of floods.
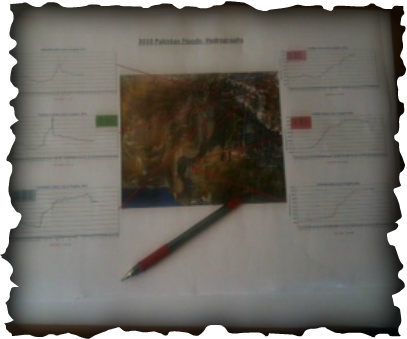
Starter: Not just any flood - Use this link to visualize the size and scale of the flood by typing in your home town into the search box at the top of the page and then clicking go. Amazing isn't it? Task 1a - Open both of these blog entries and read the information within carefully: Landslide Blog 1 & 2 Thanks to Dave's Landslide Blog. Task 1b - Copy the Google earth topographic map into a word document or cut and paste into the centre of a document leaving adequate space around. Task 2 - Place each of the recorded hydrographs into order along the River Indus. Print out as A3. (see example below) Task 3a - Google Earth co-ordinates**. Students then use these (listed to the right in the grey/black buttons) to explore the area on Google Earth. **You will need to have Google Earth open in the background and these links will take you straight to the location. Task 3b - Annotate physical and human factors influencing the rates of discharge and behaviour of the 'flashy flood' in each of the six loactions. Task 4 - Open up a new Word document and add the case study title. With your graphs and annotations in front of you, write an account of the waters progress down the river including details of peak discharge rates, the length of the peaks and work out the total lag time between the peak discharge at the first location with that of the last location. Make sure you use dates, discharge and height of the flood water in your description. What could have caused the spatial (long term) and temporal (long term) variations in these hydrographs? Task 5 - Using the hydrographs prediction news article below, examine the role of hydrographs in forecasting the magnitude (define), spatial extent and timing of floods. Hydrographs Prediction - Information sheet to be used by students. |
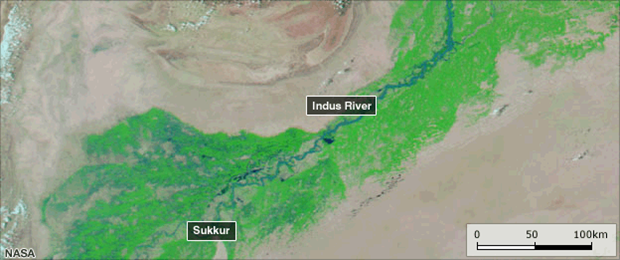
Click to enlarge
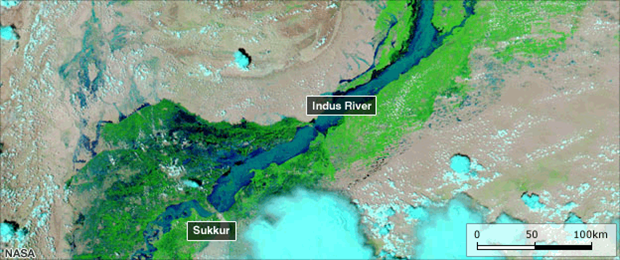
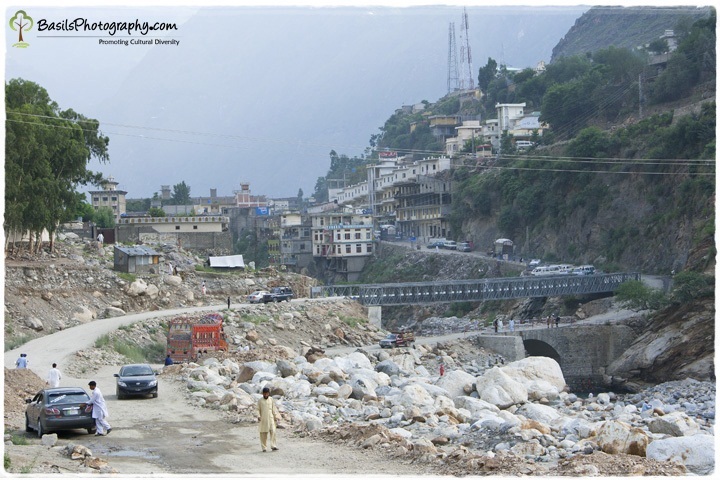
Click to enlarge. Approximately how far is it from bank to bank during peak discharge?
Google Earth Co-Ordinates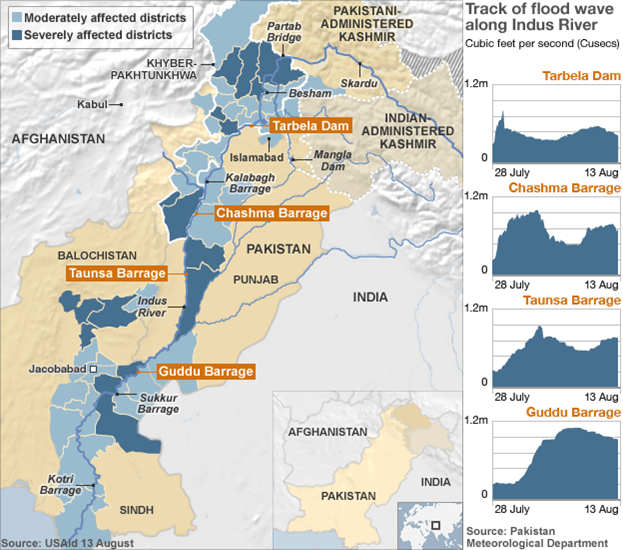
|
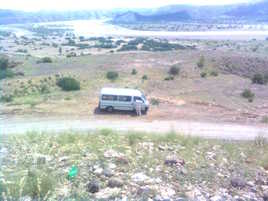
Besham, Pakistan
|
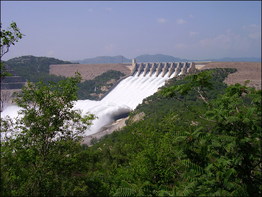
Tarbela, Pakistan
|
Taunsa, Pakistan
|
Pakistan Flood 2010 - Case Study
|
Objective: To be able to discuss the natural and human causes and consequences of a specific river flood.
Task 1 - You are going to be completing a case study of the Pakistan Floods in 2010. To do this, we will be using the information on GATW. Click here to access the page directly. You will need to fill in this two sided recording sheet. Watch the videos to the right hand side and below. The second economic video - first 10 mins only. Economic Consequences |
Social Consequences |
Could The Floods Have Been Prevented?
Higher Level further research - Spend 23 minutes watching the following news report, taking notes and adding details to your revision grid from GATW